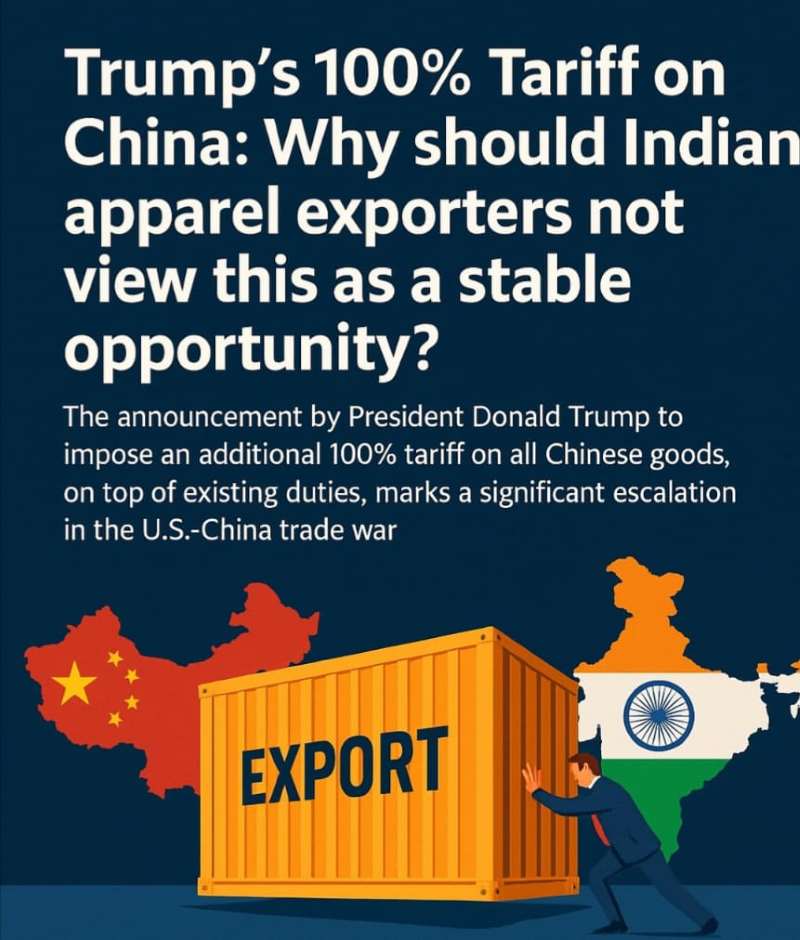
The announcement by President Donald Trump to impose an additional 100% tariff on all Chinese goods, on top of existing duties, marks a significant escalation in the U.S.-China trade war. This dramatic policy shift, characteristic of the President's recent history of abrupt and high-stakes trade decisions, injects extreme volatility and unpredictability into global supply chains. This most recent move, primarily in response to China's new export controls on rare earth materials, is set to take effect from November 1, 2025, or sooner. For the global textile and apparel industry, which relies heavily on China as a major supplier, this tariff—effectively raising total duties on Chinese goods to over 130% —presents both a colossal supply chain disruption and a massive potential export opportunity for alternative countries, including India.
Should India view this as a stable opportunity?
While the tariff threat immediately positions India as a potential beneficiary in the short term, the opportunity is not stable and is fraught with significant competitive and geopolitical risks.
The Double-Edged sword for India
1. Immediate advantage (The silver lining): The sheer increase in the cost of Chinese textiles and apparel in the U.S. market will render them virtually uncompetitive. This price disparity creates a massive vacuum that U.S. buyers must fill. Indian exporters are reportedly already seeing an "upper edge" and "huge export opportunities"
2. The Competitiveness hurdle (The major risk): India's own textile and apparel sector is already facing a major headwind: U.S. tariffs of 50% on Indian goods, a rate much higher than competitors like Bangladesh and Vietnam, which face tariffs around 20%.
○ This 50% tariff (imposed in a separate development concerning Russia oil purchases) severely undercuts India’s cost advantage, leading to drastic order reductions and factory shutdowns in key hubs like Tiruppur
○ Exporters are offering steep discounts (20-25%) to retain U.S. buyers, effectively exporting at a loss to cover the high duty.
A door opens, but a wall remains
The new 100% tariff on Chinese goods may appear to open a lucrative door for India — but its own 50% tariff acts as a wall. While U.S. brands seek to de-risk their supply chains from China, they are turning toward countries with lower duties and greater trade predictability. As one industry voice put it, “Now this 100% additional tariff on Chinese goods will give us an upper edge... but the 50% tariff has dealt a severe setback to India’s industry. Some exporters are relocating their operations to Vietnam and Bangladesh, where tariffs are significantly lower, at around 20%.” Unless a swift U.S.-India trade deal reduces this barrier, India risks watching opportunity flow past its borders—straight to more tariff-friendly rivals.
The Basket Up for Grabs: Product-wise analysis
China remains the dominant, albeit declining, supplier of textiles and apparel to the U.S. market. The total U.S. imports of textiles and apparel in 2024 were approximately $107.72 billion, with China accounting for the largest share.
Key Chinese Export Categories to the U.S. (Textiles & Apparel)
|
U.S. Import Category (2024 Value from China) |
Total Value (Approx.) |
China's Rank/Share |
Analysis & Opportunity |
|
Articles of apparel, knit or crocheted (HS 61) |
$10.63 Billion |
Top Supplier |
A massive chunk of the market. Includes T-shirts, sweaters, and most sportswear. |
|
Other made textile articles, sets, worn clothing (HS 63) |
$9.37 Billion |
Top Supplier |
Includes home textiles (bed linen, curtains, towels), essential non-apparel items. |
|
Articles of apparel, not knit or crocheted (HS 62) |
$7.76 Billion |
Top Supplier |
Includes trousers, jackets, skirts, and other woven garments. |
|
Footwear, gaiters and the like (HS 64) |
$10.28 Billion |
Top Supplier |
Significant value, often sourced alongside apparel. |
|
Wadding, felt, nonwovens, yarns, twine, cordage (HS 56) |
$0.69 Billion |
Top Supplier |
Intermediate products, crucial for other countries' final garments. |
(Data compiled from U.S. Import Data 2024, HTS codes, and US International Trade Commission reports, e.g., Source: Trading Economics, USITIC)
What all is up for grabs?
Virtually the entire value of Chinese textile and apparel exports to the U.S. is now up for competition. The immediate demand shift will prioritize the high-volume, lower-margin segments like basic knit apparel (T-shirts, undergarments) and standard woven garments (like trousers and basic shirts), where price sensitivity is highest.
India’s competence to grab the basket
India's strengths are concentrated in specific areas, which align with portions of the Chinese export basket:
1. Cotton and Cotton-Based products: India has a complete value chain, from raw cotton to finished goods. It is highly competitive in Home Textiles (towels, bedsheets, curtains) and Cotton Apparel (knitwear from Tiruppur, woven goods). In 2024, India held an approximate 7.96% share of U.S. textile imports, selling $9.71 billion worth of textiles. India's textile exports grew by 17.2% in 2024, outpacing China (14%) in the textile segment .
2. Specialty and High-Value items: India also has competence in niche markets like silk and certain high-end cotton and blended fabrics.
3. End-to-End manufacturing: Unlike countries that specialize only in garmenting (like Bangladesh, which imports most of its fabric), India can supply yarn, fabric, and garments, offering better supply chain control.
However, to convert this competence into market share, India needs:
● Policy intervention: Urgently addressing the 50% U.S. tariff to create a level playing field with Vietnam and Bangladesh.
● Scale and speed: China's dominance is built on massive, vertically integrated factories and rapid turnaround. Indian manufacturers need to ramp up capacity and improve logistics efficiency to absorb the massive orders that are shifting.
Case Study and Data Analysis: India vs. Competitors
The most crucial data point is the effective U.S. tariff rate on imports, as this directly determines the final landed cost for U.S. buyers.
|
Exporting Country |
Pre-Tariff China (Hypothetical) |
New Tariffs on China |
Vietnam/Bangladesh (Approx.) |
India (Current) |
|
Effective U.S. Tariff Rate (%) |
30% (Pre-Sept 2019 avg) |
130% + |
≈20% |
50% |
|
Competitive Impact |
Highest |
Uncompetitive |
Highly Competitive |
Severely Disadvantaged |
Leading suppliers to U.S. fashion brands, intend to shift operations
Faced with the existing 50% U.S. tariff, leading suppliers to U.S. fashion brands, have expressed intentions to shift major parts of its operations to its manufacturing units in Bangladesh and Vietnam in the coming months, clearly demonstrating that for a U.S. buyer, a zero-cost Chinese import becoming unviable does not automatically mean a shift to India. It means a shift to the next most cost-competitive and stable option, which, due to the tariff differential, is currently Vietnam or Bangladesh.
The 100% additional tariff on China; a seismic shift
The 100% additional tariff on China creates a seismic shift, freeing up tens of billions of dollars in export value. For India, this is a short-term, high-potential but high-risk opportunity. Converting it into a stable, long-term gain is conditional upon the Indian government successfully negotiating a reduction in the U.S.'s 50% tariff on Indian goods, thereby allowing Indian exporters to leverage their core competence in cotton-based textiles and apparel. Otherwise, the majority of the shifting "basket" will be claimed by India's Southeast Asian competitors.


