
FW
Cost, climate and scale push polyester ahead in the global fiber race

The global textile industry is entering a decade where commercial economics, rather than fiber heritage, dictates sourcing decisions. The latest joint report by Organisation for Economic Co-operation and Development (OECD) and the UN Food and Agriculture Organization (FAO) highlights, polyester is expected to remain cotton's strongest competitor through 2035, supported by its lower cost base, expanding manufacturing capacity and broad industrial applications.
For apparel manufacturers operating under persistent margin pressure, fiber procurement is becoming a financial exercise. Polyester's cost advantage, combined with predictable chemical feedstocks and scalable production, is encouraging mills and brands to reduce their dependence on natural fibers. While cotton demand is projected to keep growing, its pace is unlikely to match the rapid increase of synthetic fiber consumption, particularly in mass-market fashion, sportswear and everyday apparel.
Price gap reshapes procurement
The growing cost differential between cotton and polyester has become one of the biggest drivers behind sourcing decisions. So far, cotton has traded at an average premium of around 77 per cent over polyester, with the gap periodically exceeding 100 per cent. Although petrochemical inputs such as Purified Terephthalic Acid (PTA) and Monoethylene Glycol (MEG) have seen temporary price volatility due to energy costs and shipping disruptions, synthetic fiber production has remained considerably more buoyant than agricultural supply chains.
As a result, mills continue increasing synthetic production, with polyester filament utilisation rates steadily rising beyond 60 per cent. Predictable raw material availability offers manufacturers greater production planning certainty than weather-dependent cotton crops. The long-term sourcing outlook show why synthetic fibers continue gaining ground.
Table: Fiber sourcing outlook
|
Market category |
Core target |
Sourcing impact |
|
Global Raw Cotton Growth |
1.2% CAGR |
Outpaced by synthetic filament adoption rates |
|
Total Production Target |
29.5 mn tonnes by 2034 |
Driven by yield gains over acreage expansion |
|
Global Cotton Trade Growth |
1.6% annual trade volume expansion |
Driven by raw shipments to low-cost Asian mills |
|
Export Consolidation Share |
66% (Two-thirds) global total |
Controlled strictly by Brazil and the United States |
|
Nominal Fiber Price Gap |
77% to 100%+ margin variance |
Favors synthetic procurement for volume retail lines |
The data suggests that even as cotton consumption grows gradually, polyester will continue strengthening its position across global sourcing strategies.
Climate adds pressure
Beyond pricing, climate variability is becoming another disadvantage for cotton. The OECD-FAO outlook projects modest downward pressure on real cotton prices over the coming decade despite mounting production risks. Prolonged drought conditions across the US cotton belt, erratic monsoons in India and broader climate-related disruptions are making cotton yields less predictable. These uncertainties are encouraging mills to diversify fiber compositions rather than rely solely on natural fibers.
Polyester-cotton blends have consequently become a preferred solution for manufacturers seeking to balance durability, affordability and stable raw material availability. Such blends are being adopted across casualwear, denim and athleisure categories where consumers remain highly price sensitive.
Meanwhile, the concentration of global cotton exports is an additional supply risk. Brazil and the US are expected to account for nearly two-thirds of global raw cotton exports by 2035, increasing sourcing dependence on a relatively small group of exporters. Processing activity, however, will continue shifting toward Asia, with India, Bangladesh and Vietnam expected to strengthen their roles as major textile manufacturing hubs owing to competitive labour costs and expanding industrial capacity.
Sustainability raises polyester's value
Polyester's commercial advantage is happening concurrently with a parallel sustainability shift. Many global fashion companies are replacing virgin polyester with recycled Polyester Staple Fiber (rPSF) to meet environmental commitments and prepare for stricter regulations governing plastics and carbon emissions. Unlike virgin polyester, however, recycled polyester commands a premium.
Limited feedstock availability, expensive collection systems and processing bottlenecks mean that high-quality rPSF produced from recycled PET bottles typically costs between 10 and 15 per cent more than virgin polyester. Despite the premium, many global apparel companies are absorbing the additional material costs. The investment is being viewed as strategic rather than discretionary, particularly as brands prepare for tightening sustainability regulations and rising consumer demand for lower-impact products across Europe and North America.
Blended the new standard
Recent sourcing decisions by a leading European fast-fashion retailer show the industry's broader change. Facing higher cotton prices during early 2026, some retailers revised specifications for several denim and knitwear collections, replacing 100 per cent combed cotton with a 60:40 poly-cotton blend incorporating mechanically recycled polyester.
The material substitution delivered measurable operational benefits within a single quarter. Yarn procurement costs declined by 14 per cent, while fabric tear strength improved by 22 per cent, reducing manufacturing defects and improving production efficiency. At the same time, partnerships with chemical recycling suppliers enabled the company to retain its sustainability positioning while protecting retail prices from agricultural supply volatility.
This reflects a broader sourcing strategy emerging across the global apparel industry, one that combines cost optimisation with environmental compliance.
Thus the OECD-FAO outlook indicates that polyester's leadership is no longer simply the result of lower prices. Instead, it reflects a transformation across global textile supply chains where procurement priorities revolve around predictable costs, supply reliability, manufacturing scalability and sustainability compliance.
Cotton is expected to remain an essential natural fiber, particularly for premium products and markets that value natural materials. However, growing climate uncertainty, concentrated export supply and persistent price premiums are likely to reinforce polyester's dominance in mainstream apparel production through 2035. For textile manufacturers and retailers alike, future competitiveness will depend less on choosing between natural and synthetic fibers than on optimising the balance between performance, affordability and environmental responsibility.
Fabric companies stitch together growth despite margin pressures in Q1 FY27
India's pure-play fabric segment entered FY27 with renewed operational confidence as easing raw material costs and stronger domestic demand lifted revenues across most leading manufacturers. Yet, beneath the encouraging top-line growth, the first quarter highlighted a reality: while integrated manufacturers translated operating force into healthier margins, consumer-facing fabric brands grappled with higher retail expansion costs that diluted profitability.
The June 1, 2026 removal of 11 per cent import duty on cotton proved to be the quarter's defining catalyst. Combined with stabilizing ocean freight rates and improving demand for premium suitings, shirtings and performance fabrics, the policy eased the raw material pressure that had constrained manufacturers throughout FY26. However, the benefits were distributed unevenly, depending on each company's fiber mix, level of vertical integration and capital allocation strategy.
Scale rewarded integrated players
The earnings season revealed that integrated manufacturing continues to offe the strongest defence against market volatility. Companies with large-scale weaving, processing and finishing capabilities captured the benefits of lower cotton costs while maintaining healthy utilization levels.
Table: Consolidated financial performance Q1 FY27 overview
|
Company |
Q1 FY27 Revenue |
YoY growth |
EBITDA margin (Q1 FY27) |
Growth driver |
|
Vardhman Textiles (Fabric & Processing) |
Rs 2,466 cr |
11.50% |
14.8% |
Cotton duty relief and synthetic fabric capacity expansion |
|
Arvind Ltd (Fabric Business) |
Rs 1,279 cr |
15.50% |
12.50% |
Strong institutional demand and reduced discounting |
|
Raymond Lifestyle (Branded Fabrics) |
Rs 780 cr |
8.90% |
16.2% |
Premium suiting and shirting demand |
|
Siyaram Silk Mills |
Rs 400 cr |
21.10% |
8.20% |
Premium fabric growth offset by retail investments |
|
Donear Industries |
Rs 197-239 cr |
Stable to 21.3% |
4.5% |
Stable synthetic volumes amid cost pressures |
Vardhman Textiles emerged as one of the strongest performers riding on lower cotton costs and the ramp-up of its 18 million metre annual synthetic fabric line. EBITDA margin grew nearly 15 per cent, reflecting the advantage of operating at scale while diversifying beyond conventional cotton fabrics.
Arvind delivered a similar quarter. The company benefited from higher full-price realization, stronger institutional demand and disciplined inventory management, allowing margins to improve despite a competitive retail environment. Raymond Lifestyle also maintained healthy profit as premium wool-blend suitings continued to attract domestic consumers, demonstrating that premiumization remains an effective hedge against broader pricing pressures.
Revenue growth masked profit spread
Although revenue growth was widespread across the sector, profit conversion varied. Siyaram Silk Mills shows this clearly. The company posted the highest revenue growth among major fabric players, with income rising 21.1 per cent year-on-year to Rs 400 crore. Yet its EBITDA margin declined from 10.3 per cent to 8.2 per cent, while net profit fell sharply from Rs 12 crore to Rs 5 crore.
The reason was less about weak demand and more about investment timing. Siyaram accelerated the rollout of its ZECODE and DEVO retail formats, increasing lease expenses, employee costs and promotional spending. Early monsoon conditions further softened discretionary retail purchases, limiting the immediate return on these investments. The quarter reinforced a broader lesson for India's branded fabric companies: expanding direct retail ownership strengthens long-term market positioning but temporarily depresses profitability during the gestation phase.
Synthetic specialists faced a different battle
For manufacturers with greater exposure to polyester, viscose and nylon blends, raw material dynamics remained more complicated. Donear Industries continued to maintain stable business volumes through institutional customers and wholesale dealer networks. However, profitability remained constrained by elevated energy costs, freight expenses and fluctuations in petrochemical derivatives such as PTA and MEG, which underpin synthetic yarn production.
Its EBITDA margin remained around 4.5 per cent, highlighting that while synthetic fabrics reduce dependence on cotton volatility, they introduce exposure to energy-linked cost structures. This contrast shows that fiber diversification alone is insufficient. Manufacturers must also manage procurement efficiency and production scale to preserve margins.
A shift from FY26
Compared with FY26, the industry's operating environment improved considerably. Last year was characterized by domestic cotton prices trading at premiums of 8-12 per cent above international Cotlook A benchmarks, increased freight costs and widespread inventory correction across apparel retail. Those conditions squeezed gross margins and forced companies to prioritize cost control over expansion.
Q1 FY27 marked the beginning of a different cycle. The cotton duty exemption immediately narrowed raw material costs, synthetic capacity additions started contributing commercially, and freight normalization improved export competitiveness.
At the same time, investment priorities evolved. Whereas FY26 capital expenditure focused primarily on modernizing processing facilities and manufacturing assets, the current fiscal has seen several companies redirect capital toward branded retail expansion and channel ownership. While strategically important, this transition has introduced short-term pressure on earnings before these investments mature.
Flexibility the new competitive edge
Perhaps the clearest lesson from the quarter is that profit depends on operational flexibility rather than production volume alone. Integrated manufacturers capable of processing multiple fibers including cotton, polyester, viscose, linen and wool blends were better positioned to respond to changing raw material economics. Likewise, companies with extensive processing infrastructure absorbed fixed costs more efficiently than fragmented manufacturers operating with thinner asset bases.
The quarter also showed that disciplined pricing and reduced promotional activity generated stronger operating leverage than aggressive discount-led volume growth. In effect, India's leading fabric producers are gradually shifting from competing primarily on manufacturing capacity toward competing on supply chain agility, product mix and capital efficiency.
Outlook brightens for the second half
Looking ahead, industry sentiment remains cautiously optimistic. The festive and wedding seasons are expected to stimulate demand for higher-margin suitings, shirtings and premium fabric collections, particularly for companies such as Raymond Lifestyle, Siyaram Silk Mills and Donear that maintain strong domestic distribution networks.
Meanwhile, export-oriented manufacturers stand to benefit from improving inventory replenishment across North America and Europe as global buyers resume sourcing after prolonged destocking. Stabilized freight rates and lower cotton input costs should further strengthen India's competitiveness in international fabric markets.
However, the next phase of growth will likely depend less on favorable raw material cycles and more on execution. Companies that combine fiber flexibility, integrated manufacturing and disciplined retail expansion appear best positioned to convert improving market conditions into sustainable earnings growth.
For India's fabric industry, Q1 FY27 was not simply a quarter of recovery it marked the emergence of a more resilient operating model where strategic investment, supply chain integration and capital discipline increasingly define competitive advantage.
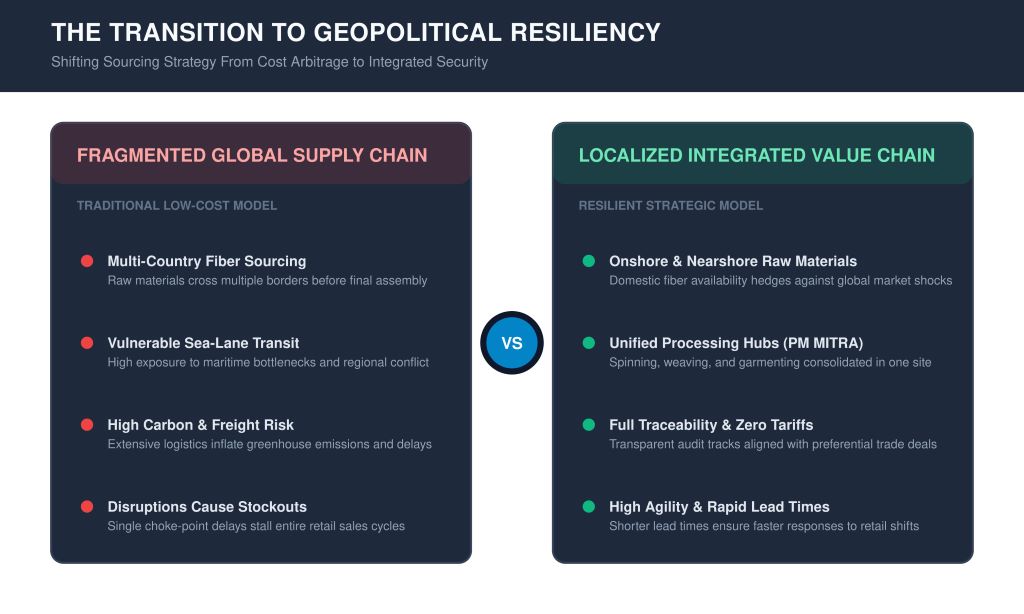
From Stubble to Silk: How agricultural residues are unlocking India’s circular fiber frontier
Every autumn across northern India, millions of tons of agricultural crop residue are burned in open fields, creating a seasonal environmental liability. Yet, inside the strategy sessions at the Bharat Tex Roundtable, trade experts, sustainability leaders, and global brand strategists reframed this crisis into an unprecedented economic opportunity.
As climate change volatilely impacts traditional cotton yields and Western regulations demand non-virgin raw materials, India stands on the brink of a material revolution. By converting agricultural waste into high-value, next-generation chemical textile fibers, India can simultaneously solve crop burning, build climate resilience, and capture leadership in the global circular economy.

Beyond Cotton Dominance: Hedging against climate vulnerability
While India has historically relied on its massive cotton crop as the backbone of its textile export industry, global markets are rapidly diversifying. Roundtable panelists pointed out that traditional agricultural fiber baskets are increasingly under threat from rising global temperatures, unpredictable monsoon cycles, and pest pressures.
To maintain its competitive edge and meet global demand, the Indian textile ecosystem must urgently scale alternative natural fibers and chemical recycling pathways. Transitioning to agricultural residues—such as wheat straw, pineapple leaves, milkweed, and hemp—allows manufacturers to hedge against cotton crop volatility while supplying global brands with circular inputs that do not compete with food crops for arable land or water. Says Nicole Rycroft, Founder and Executive Director, Canopy Planet, "India is already a leader when it comes to mechanical recycling, but increasingly important will be chemical recycling, especially for textile waste and a way to valorize what is currently being treated as waste, both on the textile waste side as well as with agricultural residues."
The Farm-to-Fashion Proof of Concept: Turning wheat straw into high-fashion Lyocell
The promise of agricultural residue fibers is no longer just a laboratory concept; it has already been proven at a commercial standard. During the roundtable deliberations, delegates highlighted successful international pilot trials that successfully transformed raw Indian wheat straw into commercial-grade lyocell and viscose fibers.
Collaborating with major global fashion brands including H&M, C&A, and Reformation; these trials demonstrated that agricultural waste can be harvested, chemically processed, and spun into soft, durable, high-fashion textiles that meet rigorous international quality benchmarks.
"We worked with a number of brands, H&M, C&A, and Reformation, on a pilot trial to prove that you could take Indian wheat straw and turn it into a lyocell fiber for application into textiles. Incredibly promising results... it just shows the diversity of fiber options that India has given the volume of residues left over every year.", adds Nicole
This farm-to-fashion pipeline offers a dual dividend: it creates a brand-new, secondary revenue stream for Indian farmers while providing global apparel houses with the low-carbon, next-generation raw materials required to meet their 2030 public sustainability targets.
The Industrial Commons Requirement: Infrastructure, aggregation, and capital
Despite successful pilot programs, scaling next-generation fibers from tons to megatons requires overcoming significant supply chain hurdles. Collecting lightweight, highly distributed agricultural residue across millions of small farm holdings demands a centralized aggregation and pre-processing network.
Participants at Bharat Tex emphasized that individual textile manufacturers cannot bear the burden of building this raw material collection infrastructure alone. The government must step in to build a national "industrial commons", a shared network of regional aggregation centers, mechanical pre-processing hubs, and specialized chemical recycling facilities.
To accelerate this transition and build a resilient circular economy, industry leaders urged policymakers to deliver three targeted strategic interventions. First, the nation needs dedicated raw material aggregation hubs established near major agricultural clusters to systematically bundle, clean, and densify crop residues before they are transported to processing units.
Second, the government must extend direct financial incentives and expand Production Linked Incentive (PLI) allocations to encourage private capital injection into advanced chemical recycling plants capable of handling both agricultural waste and post-consumer textile waste.
Finally, policy architects must achieve seamless integration by directly linking national agricultural waste management schemes with textile innovation mandates, thereby creating an unhindered, streamlined supply chain extending from farm fields to spinning mills.
"Circularity is no longer just a strategic edge. It's increasingly a market entry requirement. Whatever the government can do to help with the investing in the raw material aggregation and preprocessing as well as the chemical recycling capacity, it will position India very competitively.", emphasizes Nicole
Securing India’s material leadership
As global competitors like China rapidly align policy and capital to dominate next-generation fiber manufacturing, India’s vast agricultural footprint gives it a distinct natural advantage. By converting crop residue liabilities into high-value circular raw materials, India can protect its export supply chain against climate shocks, satisfy stringent Western regulations, and lead the global fashion industry into a sustainable future.
Odisha secures Rs 20,000 crore investments in T&A segments
Odisha is converting its traditional labor reserve into an integrated manufacturing base, attracting over Rs 20,000 crore investments in the apparel and textile sector. Strategic policy interventions - including monthly wage subsidies of up to Rs 1,500 per worker for three years alongside turnkey 'plug-and-play' industrial parks - are incentivizing capital reallocation from mature manufacturing clusters. By combining domestic cotton sourcing with net-zero water processing facilities, state-backed manufacturing operations now achieve operational efficiency superior to offshore units in Bangladesh.
Corporate expansion case study: Page Industries in Ramdaspur
Anchor commercial investments underscore this regional momentum. Page Industries recently commissioned a Rs 750-crore apparel campus in Ramdaspur, Cuttack - its largest manufacturing unit outside Southern India - creating 5,850 direct positions. Complemented by an upcoming Rs 258-crore secondary facility in Khordha, the project anchors the company's long-term volume expansion. Odisha is moving with purpose from promise to performance, stated Mohan Charan Majhi, Chief Minister during the facility inauguration, highlighting a target to create 40,000 textile sector jobs nationwide.
Logistical constraints and labor advantage
Industrial expansion continues despite supply chain bottlenecks in synthetic yarn availability and port feeder freight infrastructure. However, low attrition and structured workforce training through state vocational institutes offset these operational friction points. With additional commitments such as Shahi Exports Rs 145.5 crore Sambalpur facility, Odisha is solidifying its position as Eastern India’s primary garment export hub.
Page Industries manufactures and distributes innerwear, loungewear, and activewear as the exclusive licensee of Jockey International across South Asia. Established in 1994, the Bengaluru-based company generates over Rs 4,700 crore in revenue. Its strategic expansion into Odisha targets double-digit production growth across expanding domestic and regional retail markets.
Global textile machinery shipments shrink as spinning segment resists downstream slowdown
Global equipment deliveries contracted across downstream fabric manufacturing during 2025, while primary yarn production machinery recorded resilient expansion. According to the 48th annual International Textile Machinery Shipment Statistics released by the International Textile Manufacturers Federation (ITMF), short-staple spindle shipments grew to 6.11 million units, while open-end rotor deliveries expanded 3.5 percent to 645,000 units. Asian mill operators - pled by capital investments in China, India, and Vietnam - absorbed 94 per cent of worldwide rotor shipments, reinforcing regional dominance in primary fiber processing. Spinning mills are prioritizing fiber yield optimization and raw material flexibility to mitigate rising input costs, stated Dr Christian Schindler, Director General, ITMF.
Downstream fabric machinery contracts amid soft retail demand
In contrast, downstream capital deployment saw sharp contractions due to cautious ordering from Western retail brands. Global shipments of double-heater draw-texturing spindles fell by 22 per cent to 743,000 units, shuttle-less looms dropped 28 per cent to 164,000 units, and circular knitting machinery deliveries decreased by 13 per cent. Elevated borrowing costs and excess fabric inventory forced textile manufacturers to delay machinery upgrades in weaving and knitting, reallocating capital toward upstream yarn efficiency.
ITMF global value chain intelligence profile
Established in 1904, Zurich-based International Textile Manufacturers Federation (ITMF) serves as the primary international association for the textile value chain. Monitoring fiber, yarn, fabric, and machinery manufacturing across major global hubs, ITMF provides critical statistical benchmarks. Operating on member subscriptions, the federation expands trade transparency to navigate global supply chain shifts.
Smart production planning unlocks 15% capacity expansion in outerwear manufacturing
Apparel manufacturers supplying global brands are accelerating the transition from legacy spreadsheets to automated production planning software to protect margins and secure on-time execution. Outerwear producer Humana Apparels recently addressed schedule fragmentation across its operations by integrating Coats Digital’s FastReactPlan platform. Prior to implementation, disconnected scheduling files and manual tracking led to line idle time and delayed order confirmation. By establishing real-time data synchronization between pre-production milestones, material availability, and sewing line capacity, the company eliminated workflow friction, resulting in a 15 per cent increase in overall capacity utilization and an 8 per cent gain in direct labor productivity.
Operational re-alignment drives on-time delivery metrics
Dynamic scheduling capabilities allow plant supervisors to rebalance workloads instantly when order specifications or material lead times fluctuate. Transitioning to a synchronized planning environment allows the company’s management teams to identify capacity bottlenecks in advance and adjust lines before delays affect shipping schedules, noted Suresh Pradhan, Head- Operations at Humana Apparels. The system optimization enabled a 5 per cent improvement in On-Time Delivery Performance (OTDP) while lowering operational variance. As global outerwear brands compress order lead times, real-time factory floor visibility is proving essential for high-volume export suppliers seeking sustained commercial growth.
Targeting double-digit annual growth
The software division of industrial thread leader Coats Group plc, Coats Digital provides enterprise supply chain and production planning software to fashion brands and manufacturers globally. Managing over 1,500 factory deployments, the firm generates recurring software revenues while targeting double-digit annual growth by expanding AI-driven workflow tools across global apparel hubs.
Omnichannel expansion drives Mango towards €4 billion milestone
Spanish fashion retailer Mango achieved H1, Q26 turnover of €1.852 billion, representing a 10.7 per cent expansion at constant exchange rates year-on-year. The performance keeps the Barcelona-based retailer on track to fulfill its 4Es Strategic Plan target of €4 billion in annual revenue. Growth was led by the digital channel, which posted double-digit revenue expansion and accounted for 32 per cent of total group sales. International operations generated 77 per cent of overall turnover, driven by core markets including Spain, France, Germany, Turkey, and the United States. To support cross-channel demand, the group deployed nearly €90 million in capital expenditure during the six-month period, opening 127 new stores and expanding its global footprint to over 2,960 locations across 120 countries.
Strategic partnerships strengthen international market footprint
To mitigate operational cost pressure in mature markets, Mango is deploying targeted commercial partnerships alongside elevated brand campaigns. A recent distribution agreement with Italian department store chain COIN will establish 22 new retail locations between 2026 and 2028, supported by a €66 million commitment to open 45 stores in France. High-profile capsule collaborations with British tailoring firm Richard James and American label Eckhaus Latta have further improved full-price sell-through rates across womenswear and menswear. The brand is entering the final stretch of their 4Es Strategic Plan with a clear ambition to reach €4 billion in revenue this year, states Toni Ruiz, Chairman and CEO, Mango, highlighting sustained market share gains.
Targeting €4 billion revenue with retail expansion
Founded in Barcelona in 1984, Mango designs and distributes womenswear, menswear, and childrenswear. Operating across 120 international markets, the company generates over €3.7 billion in annual turnover. Its 4Es Strategic Plan targets €4 billion in revenue by accelerating global physical retail expansion and digital channel integration.
D2C channel acceleration elevates Adidas to record €6.7 billion revenue in Q2, FY26
Sportswear giant Adidas AG expanded Q2.FY26 currency-neutral sales by 14 per cent Y-o-Y to achieve record net revenue of €6.7 billion. Growth was anchored by direct-to-consumer (DTC) channels, which expanded 25 per cent globally, supported by a 27 per cent rise in e-commerce orders. Performance gear increased by 39 per cent, fueled by strong international demand for football and running product lines during major global sporting events. Strong product sell-through prompted management to raise full-year 2026 revenue guidance to between 9 per cent and 10 per cent growth. This momentum reflects exceptional global demand across all key regional markets, proving that product heat and direct retail execution are compounding our market share, stated Bjørn Gulden, CEO.
High-margin e-commerce scale offsets increased brand investments
Operational execution improved profitability despite strategic capital allocation toward high-profile marketing activations. Gross margin expanded 80 basis points to 52.5 per cent, enabling Q2. FY26 operating profit to reach €574 million while maintaining full-year operating earnings targets of €2.3 billion. Concurrently, the groupi named brand veteran Birgit Kretschmer as Chief Financial Officer to oversee long-term financial management. As wholesale partners allocate more shelf space to high-performance footwear and leisure apparel, Adidas is solidifying its market position against athleticwear competitors across Europe and North America.
Expanding D2C digital channels
Founded in 1949 in Herzogenaurach, Germany, Adidas AG designs and distributes athletic footwear, apparel, and hardware across global markets. Generating over €23 billion annually, the group targets double-digit operating margins by expanding direct-to-consumer digital channels and scaling high-margin performance categories across North America, Europe, and Asia-Pacific.
Adidas Q2 2026 revenue, Adidas DTC sales growth, Björn Gulden Adidas, Birgit Kretschmer CFO, Adidas e-commerce growth, performance sportswear demand, football running apparel sales, Adidas gross margin 2026, sportswear retail trends, global athleticwear market
Gucci restructures retail footprint as sales decline narrows to 2%
Kering’s flagship luxury house Gucci generated €1.41 billion in second-quarter revenue, narrowing its organic sales decline to 2 per cent and outperforming consensus forecasts of a 4.7 per cent contraction. The performance represents a sequential improvement from the 8 per cent decline in Q1,FY26, propelled by a 9 per cent rise in U.S. retail sales for core handbag lines. Although geopolitical friction in the Middle East reduced quarterly top-line growth by one percentage point, resilient demand for premium leather accessories stabilized store productivity across Western retail channels.
Network pruning and asset sales strengthen group balance sheet
In response to broader sector deceleration, Kering executed 84 net store closures during H1, FY26, advancing toward a full-year rationalization target of 100 locations. Disciplined cost containment alongside non-core asset disposals reduced net debt from €8 billion to €3.3 billion, lifting recurring operating margin 40 basis points to 12.8 per cent. Concurrently, Kering’s jewelry division expanded by 18 per cent to €252 million, providing operational leverage while Gucci curbs wholesale distribution. Decisive measures to streamline operations are successfully reinforcing brand distinctiveness, stated Luca de Meo, CEO, Kering. Analyst consensus projects margin expansion in the second half as retail productivity gains offset ongoing macroeconomic friction.
Florentine heritage and global retail operations
Founded in Florence in 1921, Gucci is Kering’s core luxury house specializing in high-end leather goods, apparel, and accessories. Operating across North America, Europe, and Asia-Pacific, the brand targets full-year revenue stabilization through elevated product design, network rationalization, and margin defense following H1 2026 revenues of €2.76 billion.
The Domestic Comfort Trap: Why Indian textile majors are missing the $300 Billion global window
India’s domestic retail landscape is experiencing an unprecedented boom. Fuelled by a massive consumer base, rising disposable incomes, and rapid retail expansion, the domestic textile and apparel market is rapidly surging toward $190 billion. Yet, behind this success lies a glaring structural contradiction.
Inside the strategy sessions at the Bharat Tex Roundtable, Giriraj Singh, Minister of Textiles and all trade stakeholders ; experts and government officials confronted a persistent paradox: while India's domestic consumption breaks records, its global textile export footprint remains largely stagnant. For many Indian textile majors, the booming domestic market has become a comfortable cushion, a "domestic comfort trap" that disincentivizes manufacturers from taking on the rigorous demands of global trade.
The Compliance-Free Luxury: Why domestic margins outshine exports
During the roundtable deliberations, speakers highlighted why so many domestic manufacturers prefer serving the local market over chasing international orders. Selling domestically offers solid profit margins without the intense friction, high overheads, and stringent audit standards associated with Western export markets.
Exporting to North America or Europe requires navigating complex regulatory frameworks—such as zero-liquid discharge requirements, strict chemical safety standards, carbon tracking, and full supply chain traceability. In contrast, domestic retail allows manufacturers to enjoy rapid scale without facing maritime container shortages, complex export logistics, or punitive buyer compliance audits.

"Look at the domestic market, it used to be $138 billion, and today we are reaching nearly $190 billion. People think, 'Containers are not required here, compliance doesn't need to be met here, why get caught up in foreign buyers ?Forget it!'", Giriraj Singh, Minister of Textiles, Government of India said, quoting industry sentiment.
This reluctance to face export compliance has created a growth ceiling. While domestic demand provides immediate financial stability, relying on it exclusively prevents Indian companies from building the scale and operational discipline needed to dominate global supply chains.
The $300 Billion Opportunity: Unlocking the FTA advantage
While domestic manufacturers stay focused on local retail, India’s trade negotiators have been aggressively opening doors worldwide. The roundtable emphasized that India stands at the edge of a massive trade opportunity, backed by recently signed and upcoming Free Trade Agreements (FTAs) across major global economies.
Trade officials pointed out that opening preferential trade pathways with the UK, UAE, Australia, New Zealand, and ongoing negotiations with major Western markets unlocks a combined $300 billion market opportunity. This presents a 10x growth horizon compared to India's current export figures.
However, free trade deals do not guarantee automatic market share. As trade leaders noted during the session, FTAs merely provide a ticket to the game; capturing real market share requires Indian manufacturers to step up, diversify their product offerings into synthetic/MMF garments, and meet global compliance standards.
"If you put them all together, Europe alone is a $200 billion market across 27 countries. The UK... is a $20–25 billion market. If you add the UAE, Oman, New Zealand, Australia... put it all together, it becomes a $300 billion market opportunity; as somebody said, it is a free market, not a free pass. So we need to diversify.", elaborated, Anil Kumar Sagar, Special Secretary, Government of Uttar Pradesh
From Contract Fabrication to Global Brands: The ministerial mandate
Unlocking this global potential requires a fundamental shift in mindset. Closing the roundtable, Union Textile Minister Giriraj Singh delivered a clear mandate to industry leaders: Indian textile companies must graduate from being passive third-party contract manufacturers and start building homegrown, globally competitive fashion brands.
Relying solely on job-work garment fabrication for foreign labels leaves Indian suppliers vulnerable to global price wars and razor-thin margins. To capture true value, Indian majors must invest in original design, advanced technical innovation, and global distribution networks.
"Aggressively, you too will have to step up a bit, along with the government.Sure, you do fabrication, but we also have to build 'Brand India'. That is my request as well; if we are progressive and aggressive, no force in the world can stop us." says Giriraj Singh emphatically.
Escaping the cushion to lead global trade
The domestic market will always remain a vital pillar of strength for Indian textiles. However, treating it as a safe haven from global competition risks leaving India behind as international trade realigns. By pairing domestic strength with aggressive global ambition, advanced compliance, and homegrown brand building, Indian textile majors can break out of the comfort trap and claim their space as global industry leaders.