In a significant trade development, the United States has imposed a 25% tariff on all Indian imports, effective from Aug 01, 2025. This move deals a strong blow to India’s export sectors, particularly textiles, garments, and home furnishings. Announced by President Donald Trump on July 30, the tariff comes in response to India’s “high tariffs, non-monetary trade barriers, and continued energy trade with Russia.”
While the tariff raises concerns across India’s export-dependent sectors, a closer look at product categories reveals a mixed picture. Some segments appear more insulated due to limited competition, while others are exposed to cheaper alternatives from ASEAN nations.
US Imports From India: $10 bn textile pipeline at stake
In 2024, India exported nearly $10 billion worth of textiles and apparel to the US, accounting for approximately 28–29% of its global Textile & Apparel (T&A) exports. Globally, the U.S. imported $107 billion worth of textiles, making India its third-largest supplier.
However, India’s product-wise advantage isn't uniform. According to UN COMTRADE and Moneycontrol, India holds over 50% market share in key U.S. imports such as:
|
Product Category |
Imports from India ($ Mn) |
India’s Share of U.S. Imports (%) |
|
Cotton bed linen |
817.5 |
59.40% |
|
Textile fabrics printed/laminated with plastics |
273.6 |
56.60% |
|
Carpets knotted |
176.4 |
59.70% |
|
Carpets tufted |
141.8 |
72.40% |
|
Table linen, of cotton |
129 |
72.90% |
|
Toilet and kitchen linen |
78.1 |
50.50% |
|
Basketwork, wickerwork (partially textile) |
140 |
56.00% |
In total, more than $3 billion worth of U.S. textile imports have over 60% dependence on Indian suppliers, making them less vulnerable to sourcing shifts, even with the new tariffs.
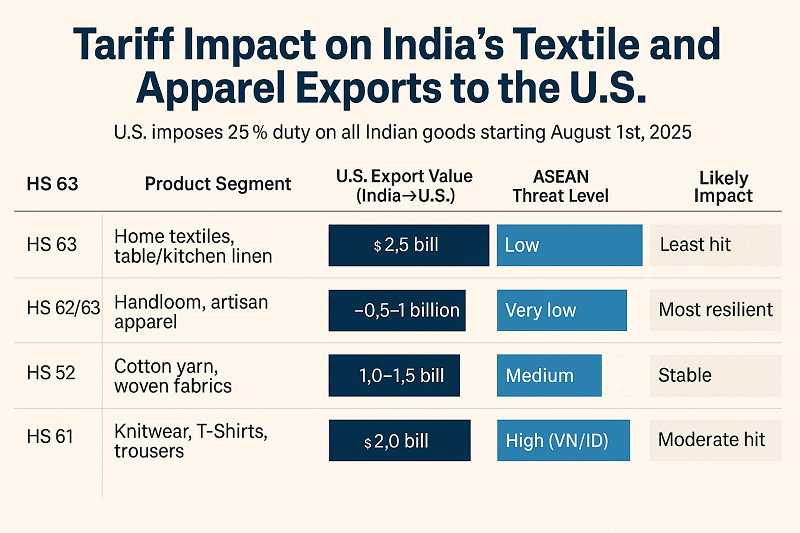
Who’s Hurt Most? : HS Code impact breakdown
HS 61 – Knitwear & Cotton Apparel-Includes: T-shirts (6109), knitted trousers (6103)
● India’s U.S. Export: ~$2 billion
● Competitive Landscape:
○ Vietnam (20%) and Indonesia (19%) are now 5% cheaper than India post-tariff.
○ Bangladesh (35%), Cambodia (36%), and China (30%+) remain more expensive.
HS 63 – Home Textiles & Crafted Linen-Includes: Bed linens (6302), towels, table linens
● India’s U.S. Export: ~$2.5 billion
● Advantage: India’s design-led, artisan-rich goods face minimal ASEAN competition.
According to Moneycontrol, India supplied:
● 83% of U.S. carpets & rugs
● 73% of table linen
● Over 60% of 13 key textile lines
This makes HS 63 India’s most resilient export category despite the tariff hit.
HS 52 – Cotton Yarn & Fabrics
● India’s U.S. Export: $1–1.5 billion
This is a less competitive segment where India enjoys a significant scale advantage; ASEAN nations do not dominate here.
HS 62/63 – Handloom & Ethnic Fashion-Includes: Sarees, GI-tagged scarves, embroidered apparel
● India’s Share: ~$0.5–1 billion
These are unique products without mass-production competition from ASEAN.
Tariffs May Bite Short-Term, But India’s Position Remains Strong:Experts say
Rahul Mehta, Chief Mentor, CMAI, explains, “This will make our products 7% to 10% more expensive than some of our competitors, and it will certainly hurt our apparel exports to the US... but it’s not beyond our ability to face.”
Sanjay K Jain, Chairman, ICC National Textiles Committee, observes, “Vietnam & Indonesia have a 5% advantage—but China, Bangladesh, Myanmar, Cambodia are at a disadvantage. USA buyers want to reduce dependency on China & Bangladesh—so where will they go?” He adds, “India does not have capacity for more than 10% growth right now—but buyers already committed to India will continue. Yes, it's a 5% hit, but it's manageable.”
He warns, however, of a bigger concern: “The penalty threat linked to Russia is the real worry. India must act—remove the 11% import duty on U.S. cotton and use savings from oil to subsidize export duties on U.S.-bound goods.”
Competitor Tariffs: Who benefits?
|
Country |
Tariff to U.S. (Post-2025) |
|
Vietnam |
~20% |
|
Indonesia |
~19% |
|
Bangladesh |
~35% |
|
Cambodia |
~36% |
|
China |
~30% + extra duties |
|
India |
25% (new) |
Despite India’s setback, the tariff differential still positions it at par with or ahead of several major exporters, especially in home and ethnic textiles.
Near-term disruption, long-term opportunity?
According to Mehta, “Fortunately, this set-back has come at a time when we’ve just signed an FTA with the UK and are proceeding rapidly with the EU. So yes, it’s tough times—but not panic time.” Sanjay Jain echoes, “Maybe the bullish feel is gone—but certainly not bearish. Apparel growth will continue—India is in a neutral position globally.”
Strategic Takeaway: Where India stands strongest
|
HS Code |
Segment |
U.S. Value |
ASEAN Threat |
Tariff Advantage |
Outlook |
|
HS 63 |
Home textiles, table/kitchen linen |
$2.5 B |
Low |
High |
Least Hit |
|
HS 62/63 |
Handloom, artisanal fashion |
~$1 B |
Low |
High |
Most Resilient |
|
HS 52 |
Cotton yarn & woven fabrics |
$1–1.5 B |
Medium |
Moderate |
Stable |
|
HS 61 |
Knitwear, T-shirts, trousers |
~$2 B |
High (VN/ID) |
Low |
Moderate Hit |
Tactical response needed, not panic
The 25% tariff poses a challenge, but India’s dominance in key U.S. categories like home textiles, carpets, and ethnic linens acts as a natural buffer. The real exposure lies in cotton apparel, where Vietnam and Indonesia now gain an edge.The path forward may lie in policy action—as Jain suggests—removing cotton duties and incentivizing value-added exports using savings from Russian oil.
As global sourcing shifts and FTAs with the UK and EU move forward, India’s textile sector remains challenged but not cornered. Its resilience may yet convert this crisis into a competitive advantage.